In part three of our series, David Camp of D&J International Consulting looks at how to gauge your attraction’s success and how to work out market penetration rates
By David Camp | Published in Attractions Management 2016 issue 3
Zoos like San Diego Zoo in San Diego, California, publish their financial reports every year
Attraction operators often wonder how well they are doing and while large attractions groups or large municipal departments can examine key performance indicators across a number of locations and types of operations to establish this, individually-operated attractions do not have that opportunity.
For most, the only option is to look at one year’s performance against a previous year and while this is useful, it doesn’t help them understand what they could do better and who they can learn from.
This is where benchmarking and learning from others is important. But unfortunately, althought this can be an effective way to improve performance, operators can be reluctant to share information with competitors to enable this to happen.
However, there are publicly available sources of data which can be used instead and some of the most useful can be accessed through trade and industry associations across the attractions sector.
Organisations such as the International Association of Amusement Parks and Attractions (IAAPA), the International Council of Museums (ICOM), World Association of Zoos and Aquariums (WAZA), World Waterpark Association (WWA) and the Association of Science-Technology Centers (ASTC) organise conferences and events, produce reports and publications, and provide training programmes and advice.
These international organisations often have regional groups that focus on a country or area. In addition, there are large numbers of national or area-specific organisations and associations that can provide useful data sources.
Another important source of information is the trade press. It’s a lot easier to search for articles and information online today than it was in the past; indeed, the Internet has transformed research. However, with almost 1 billion websites, a lot of time can be spent searching fruitlessly. There’s no guarantee that information posted is accurate or up to date, so it’s important to double and triple-check such data.
Interpreting data Many attractions and operators produce annual reports that are available via their websites. Museums, zoos and aquariums are the most likely to publish reports along with some of the large attraction operators such as Disney, Merlin, Six Flags and Compagnie des Alpes. These reports can provide valuable understanding of sources of revenues, operating cost ratios and profitability. We will look at these aspects of financial reporting later in this series.
There is also data available through government statistics departments, tourist organisations and regional authorities.
In the UK, VisitEngland undertakes annual surveys among attractions and publishes an annual survey of attendance. In the US, visitation data is available online for all of the 412 National Parks Service operations and a range of data on museums across Europe is collated by the European Group on Museum Statistics.
But gathering information is only part of the story. Unless it’s evaluated, understood and lessons are taken from it, then the data has no value. This is particularly true with visitor attendance figures, where similar attractions in different locations can attract very different volumes of people.
The KidZania brand is a prime example of this. There are now 24 KidZania attractions around the world, all providing similar role-playing experiences to under-14s. The attractions follow a standard design template, within a 5,000 to 10,000sqm (53,800 to 107,600sq ft) space located inside a retail mall; however, they achieve very different attendance volumes. The most popular is in Tokyo, attracting around 900,000 visits each year. By contrast, the Lisbon KidZania attracts only a quarter of this volume.
The reason for these variances lies in the size and make-up of their respective catchment markets. There are 23 million people living within the one-hour catchment market for Tokyo and almost 3 million of these are under 15. Lisbon’s total one-hour market is just over 3 million people with half a million of these being under 15.
Applying a simple ratio would suggest that Tokyo should be able to attract five or six times as many visits as Lisbon, but Tokyo is operating at capacity for many days of the year, so this limits the total numbers the attraction can accommodate.
Market penetration An examination of the available markets and catchment areas is critical to understanding the potential of an attraction. When doing feasibility studies, we typically consider four segments: residents living within a one hour drive time; residents living between one and two hours away; domestic tourists staying in locations within one hour; and international tourists staying within one hour of the site. Where appropriate we would also assess any on-site accommodation users, such as those staying at a theme park hotel or camp site.
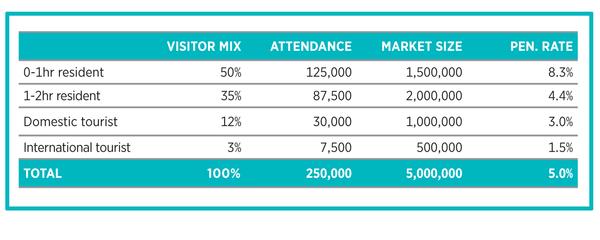
Having determined the size of the market, the next step is to evaluate the mix of visitors. This information should be available through guest survey research and applying these ratios to the annual attendance leads to calculations of the mix of visits. Dividing the attendance by the size of the segments reveals market penetration rates as shown in Table 1 (right).
Most attractions achieve their highest penetration rates among the 0-1 hour resident market. However, there are examples where tourists are dominant. At the Guinness Storehouse in Dublin, over 90 per cent of visits are from international tourists, which gives a market penetration of over 25 per cent in this segment.
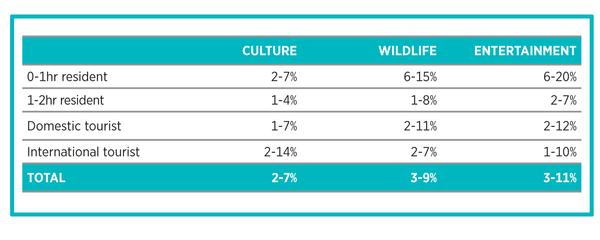
In Table 2 (right), we provide typical market penetration rate ranges for different attraction types. Entertainment attractions (theme parks, waterparks, brand centres, indoor attractions) have the highest overall market penetration rates. Cultural attractions such as museums and historic properties have more modest penetration rates, although they’re important in cities with strong tourist markets.
The ranges provide indications for the bulk of the market, but there are always attractions that achieve significantly higher penetration rates within particular segments – such as Guinness Storehouse.
Size matters Important factors impacting these penetration rates are the competitive environment and size of the market segments. Cities like New York, Paris and London have very popular attractions, but because of the size of the catchment and range of offers available, penetration rates are often relatively modest. By comparison, attractions in smaller markets such as the Guggenheim in Bilbao, Spain, and the Eden Project in Cornwall, UK, can achieve stronger penetration rates.
Understanding the available markets and an attraction’s ability to penetrate these is critical to success. When Merlin’s development team is considering locations for midway attractions (SeaLife, Madame Tussauds, Lego Discovery Centre and the Dungeons), the first thing they do is evaluate the size and nature of the market against their internal planning criteria.
Merlin knows the size and nature of the market which is required for their attractions to work and if a potential location doesn’t meet the criteria, then it isn’t considered. For Merlin and other operators, sound market research provides the foundation of their success.
Read more from this issue of Attractions Management magazine
View contents of Attractions Management 2016 issue 3
Editor’s Letter: Place-Shifting
Technology is giving us the
power to Place-Shift experiences
to create on-demand, immersive
attractions in any location
Promotional Feature: EAS - Beautiful Horizons
The attractions industry is set to descend upon one of Europe’s
most inspiring cities – Barcelona. And if it’s inspiration
you’re looking for, the Euro Attractions Show is the place
Theme Parks: Desert Operations
On the brink of an entertainment revolution, Dubai looks forward to three major theme park openings. Attractions Management caught up with key decision- makers from the upcoming attractions
Mystery Shopper: Disney Delights
Disneyland Shanghai is the company’s first new theme park resort since 2005 and its biggest investment to date. TEA president-elect David Willrich went undercover to find out what Disney’s doing differently
Analysis: Part 3 - Benchmarking
Consultant David Camp asks how we measure success as he focuses on benchmarking and market penetration rates in part three of the series
Opinion: Media Frenzy
Is it time for media-based rides to raise their game? Gavin and Jason Fox, creative directors from Oscar-winning special effects studio Framestore, believe Hollywood-standard content is the next step for the industry
This eight-part series outlines the patterns and dynamics that define every attraction – from visitor behaviour and guest spending to operating costs and profitability
CONTENTS 1. An overview 2. How are you perceived? 3. Benchmarking 4. Planning a new attraction 5. Driving revenues 6. Controlling costs 7. Is it worth it? 8. Benefits and impacts
Table 1 : Example market penetration rate calculations
In part three of our series, David Camp of D&J International Consulting looks at how to gauge your attraction’s success and how to work out market penetration rates
By David Camp | Published in Attractions Management 2016 issue 3
Zoos like San Diego Zoo in San Diego, California, publish their financial reports every year
Attraction operators often wonder how well they are doing and while large attractions groups or large municipal departments can examine key performance indicators across a number of locations and types of operations to establish this, individually-operated attractions do not have that opportunity.
For most, the only option is to look at one year’s performance against a previous year and while this is useful, it doesn’t help them understand what they could do better and who they can learn from.
This is where benchmarking and learning from others is important. But unfortunately, althought this can be an effective way to improve performance, operators can be reluctant to share information with competitors to enable this to happen.
However, there are publicly available sources of data which can be used instead and some of the most useful can be accessed through trade and industry associations across the attractions sector.
Organisations such as the International Association of Amusement Parks and Attractions (IAAPA), the International Council of Museums (ICOM), World Association of Zoos and Aquariums (WAZA), World Waterpark Association (WWA) and the Association of Science-Technology Centers (ASTC) organise conferences and events, produce reports and publications, and provide training programmes and advice.
These international organisations often have regional groups that focus on a country or area. In addition, there are large numbers of national or area-specific organisations and associations that can provide useful data sources.
Another important source of information is the trade press. It’s a lot easier to search for articles and information online today than it was in the past; indeed, the Internet has transformed research. However, with almost 1 billion websites, a lot of time can be spent searching fruitlessly. There’s no guarantee that information posted is accurate or up to date, so it’s important to double and triple-check such data.
Interpreting data Many attractions and operators produce annual reports that are available via their websites. Museums, zoos and aquariums are the most likely to publish reports along with some of the large attraction operators such as Disney, Merlin, Six Flags and Compagnie des Alpes. These reports can provide valuable understanding of sources of revenues, operating cost ratios and profitability. We will look at these aspects of financial reporting later in this series.
There is also data available through government statistics departments, tourist organisations and regional authorities.
In the UK, VisitEngland undertakes annual surveys among attractions and publishes an annual survey of attendance. In the US, visitation data is available online for all of the 412 National Parks Service operations and a range of data on museums across Europe is collated by the European Group on Museum Statistics.
But gathering information is only part of the story. Unless it’s evaluated, understood and lessons are taken from it, then the data has no value. This is particularly true with visitor attendance figures, where similar attractions in different locations can attract very different volumes of people.
The KidZania brand is a prime example of this. There are now 24 KidZania attractions around the world, all providing similar role-playing experiences to under-14s. The attractions follow a standard design template, within a 5,000 to 10,000sqm (53,800 to 107,600sq ft) space located inside a retail mall; however, they achieve very different attendance volumes. The most popular is in Tokyo, attracting around 900,000 visits each year. By contrast, the Lisbon KidZania attracts only a quarter of this volume.
The reason for these variances lies in the size and make-up of their respective catchment markets. There are 23 million people living within the one-hour catchment market for Tokyo and almost 3 million of these are under 15. Lisbon’s total one-hour market is just over 3 million people with half a million of these being under 15.
Applying a simple ratio would suggest that Tokyo should be able to attract five or six times as many visits as Lisbon, but Tokyo is operating at capacity for many days of the year, so this limits the total numbers the attraction can accommodate.
Market penetration An examination of the available markets and catchment areas is critical to understanding the potential of an attraction. When doing feasibility studies, we typically consider four segments: residents living within a one hour drive time; residents living between one and two hours away; domestic tourists staying in locations within one hour; and international tourists staying within one hour of the site. Where appropriate we would also assess any on-site accommodation users, such as those staying at a theme park hotel or camp site.
Having determined the size of the market, the next step is to evaluate the mix of visitors. This information should be available through guest survey research and applying these ratios to the annual attendance leads to calculations of the mix of visits. Dividing the attendance by the size of the segments reveals market penetration rates as shown in Table 1 (right).
Most attractions achieve their highest penetration rates among the 0-1 hour resident market. However, there are examples where tourists are dominant. At the Guinness Storehouse in Dublin, over 90 per cent of visits are from international tourists, which gives a market penetration of over 25 per cent in this segment.
In Table 2 (right), we provide typical market penetration rate ranges for different attraction types. Entertainment attractions (theme parks, waterparks, brand centres, indoor attractions) have the highest overall market penetration rates. Cultural attractions such as museums and historic properties have more modest penetration rates, although they’re important in cities with strong tourist markets.
The ranges provide indications for the bulk of the market, but there are always attractions that achieve significantly higher penetration rates within particular segments – such as Guinness Storehouse.
Size matters Important factors impacting these penetration rates are the competitive environment and size of the market segments. Cities like New York, Paris and London have very popular attractions, but because of the size of the catchment and range of offers available, penetration rates are often relatively modest. By comparison, attractions in smaller markets such as the Guggenheim in Bilbao, Spain, and the Eden Project in Cornwall, UK, can achieve stronger penetration rates.
Understanding the available markets and an attraction’s ability to penetrate these is critical to success. When Merlin’s development team is considering locations for midway attractions (SeaLife, Madame Tussauds, Lego Discovery Centre and the Dungeons), the first thing they do is evaluate the size and nature of the market against their internal planning criteria.
Merlin knows the size and nature of the market which is required for their attractions to work and if a potential location doesn’t meet the criteria, then it isn’t considered. For Merlin and other operators, sound market research provides the foundation of their success.
Read more from this issue of Attractions Management magazine
View contents of Attractions Management 2016 issue 3
Editor’s Letter: Place-Shifting
Technology is giving us the
power to Place-Shift experiences
to create on-demand, immersive
attractions in any location
Promotional Feature: EAS - Beautiful Horizons
The attractions industry is set to descend upon one of Europe’s
most inspiring cities – Barcelona. And if it’s inspiration
you’re looking for, the Euro Attractions Show is the place
Theme Parks: Desert Operations
On the brink of an entertainment revolution, Dubai looks forward to three major theme park openings. Attractions Management caught up with key decision- makers from the upcoming attractions
Mystery Shopper: Disney Delights
Disneyland Shanghai is the company’s first new theme park resort since 2005 and its biggest investment to date. TEA president-elect David Willrich went undercover to find out what Disney’s doing differently
Analysis: Part 3 - Benchmarking
Consultant David Camp asks how we measure success as he focuses on benchmarking and market penetration rates in part three of the series
Opinion: Media Frenzy
Is it time for media-based rides to raise their game? Gavin and Jason Fox, creative directors from Oscar-winning special effects studio Framestore, believe Hollywood-standard content is the next step for the industry
This eight-part series outlines the patterns and dynamics that define every attraction – from visitor behaviour and guest spending to operating costs and profitability
CONTENTS 1. An overview 2. How are you perceived? 3. Benchmarking 4. Planning a new attraction 5. Driving revenues 6. Controlling costs 7. Is it worth it? 8. Benefits and impacts
Table 1 : Example market penetration rate calculations
Expo 2030 Riyadh is being planned as a permanent visitor destination, with organisers
confirming the six-million-square-metre site will become a Global Village after the event closes.
The owner of one of Australia's best-known waterparks has acquired a major competitor,
creating a new attractions business spanning two of the country's largest visitor destinations.
The Toverland theme park in the Netherlands has announced a €98m expansion programme
that will add a resort, new attractions and staff facilities as it pursues plans to become a multi-
day destination.
Hotel de France, located on the British Isle of Jersey, has created a wellness retreat package
that includes a hot yoga session that will take place in Jersey Zoo’s butterfly sanctuary.
A new immersive attraction designed to transport visitors into the final hours of ancient Pompeii
is preparing to open near the world-famous archaeological site in southern Italy.
Experience design company, BRC Imagination Arts, has completed a transition that sees founder
Bob Rogers pass ownership of the business to four long-serving senior executives, while
remaining actively involved with the company.
Movie Park Germany has opened a new Paramount Pictures-themed attraction as part of its 30th
anniversary celebrations, using immersive storytelling and adaptive reuse to reinforce the park’s
longstanding “Hollywood in Germany” positioning.
Therme Manchester’s 28-acre development, which will include interconnected glass pavilions
that measure 65,000sq m, will be the largest bathing and wellbeing attraction in the world once
complete, according to prof David Russell, CEO of Therme UK.
Efteling has opened Hooghmoed, a new family drop tower designed to broaden the appeal of its
recently launched Sirene Island themed area and introduce younger visitors to thrill attractions.
A proposed Puy du Fou development near Bicester and Universal Destinations and Experiences’
planned resort in Bedford are emerging as part of a wider transformation of the Oxford–
Cambridge Growth Corridor into a major centre for UK leisure and tourism inv
+ More news
COMPANY PROFILES
DJW David & Lynn Willrich started the Company
over thirty years ago, from the Audio Visual
Department [more...]
Simworx Ltd The company was initially established
in 1997. Terry Monkton and Andrew
Roberts are the key stakeh [more...]