In this series of articles, we have discussed demand volumes, revenues and operating costs. Combining these leads to the critical assessment of profit or loss for a business, helping us answer the question – is it worth it?
While there is no standard financial reporting method for visitor attractions specifically, a common measure of the profits of a business is an assessment of the EBITDA (earnings before interest, tax, depreciation and amortisation). This effectively measures the core business operation and also allows comparison between attractions businesses.
Comparing the EBITDA to the total revenue provides a measure of the profit margin for the business. All too often, promoters of development projects over-state the potential profits, either through an over-estimation of the income or understating the operating costs, or both.
Analysing income
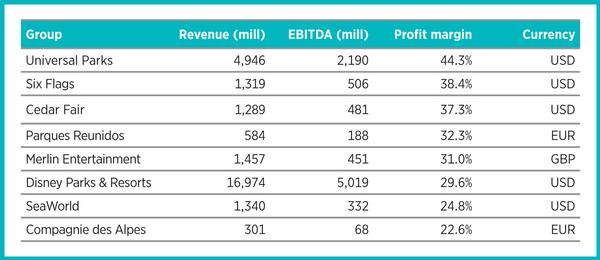
Table 1 provides revenues and profit margins for 2016 from the annual reports for a number of attractions operating groups. The average profit margin across the sample is 32.5 per cent, although, as shown, there are some variances, with Universal Parks performing particularly well on the back of the popularity of their Harry Potter-themed attractions.
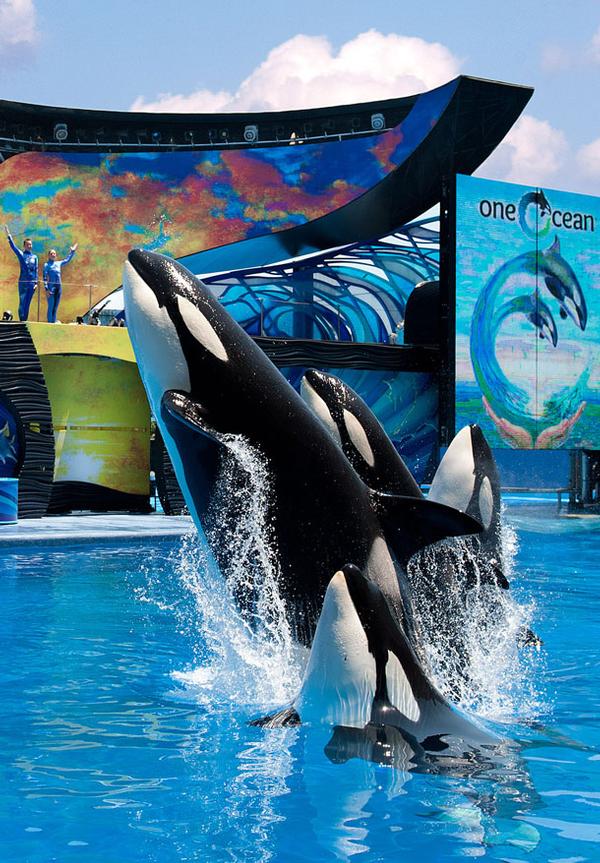
The continuing negative press coverage around keeping killer whales in captivity and the Blackfish film is impacting SeaWorld’s performance, while Compagnie des Alpes continues to wrestle with operating a diverse range of medium and small attractions across Europe.
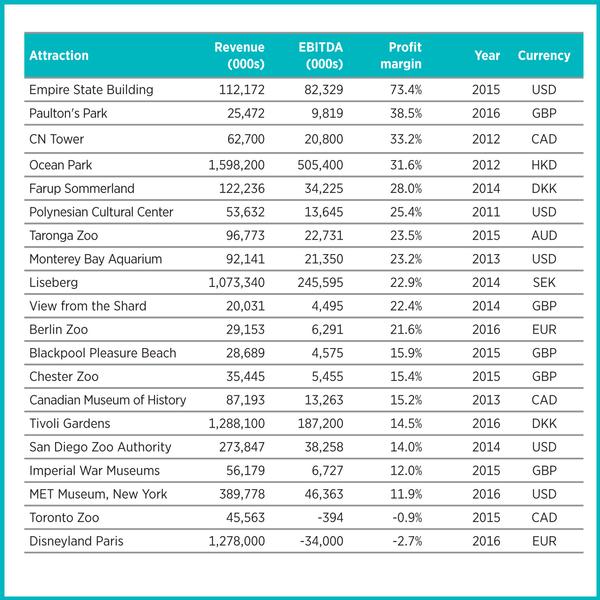
With each group operating a number of attractions, these consolidated figures mask stronger or weaker individual attraction operations. While details for individual attractions within these groups are not publicly available, there is published information available on the performance of a range of visitor attractions. We show the performance across a selection of individual attractions in Table 2.
Talking margins
The list includes a number of theme parks, entertainment attractions, museums and wildlife attractions. As shown, the majority of the attractions listed achieve EBITDA margins between 10 per cent and 40 per cent, with an average of 22 per cent. These margins are generally lower than the averages achieved by the major operators, reflecting the experience of these operating groups.
While almost all of the attractions report a positive EBITDA margin, a number of them require significant financial support from grants, donations or endowments to be able to deliver these returns. This is common with many museums and wildlife attractions where visitor revenues account for less than half of the annual revenues and it is only through external funding that the attractions can continue to operate.
As shown, while attraction operations can be profitable, even for the strongest commercial operators it is difficult to exceed profit margins of more than 35 per cent. This leads to the question of what attractions are worth and how much should be invested to create new attractions?
An attraction’s value
For visitor attractions, valuations are based on the earnings of the business, regardless of the amount invested. Sometimes there is an additional value associated with a building, if owned, but for most attractions there is little alternative use that the assets could be put to. Therefore, attractions are valued on a multiple of their EBITDA.
The assessment of what multiple to use depends upon a number of factors, such as the future potential of the business, whether the current EBITDA is strong or weak, the quality of the assets, how much future investment will be needed at the attractions, and the appetite of the investor for the business.
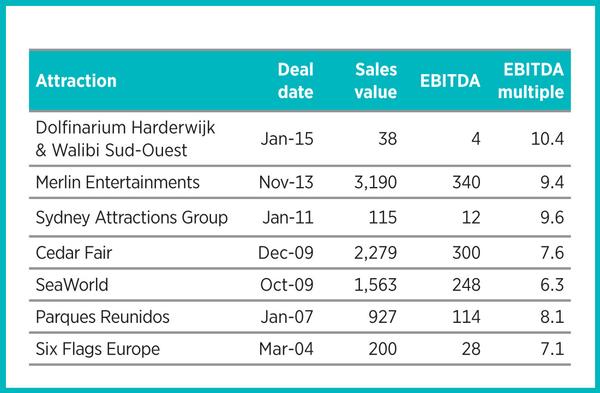
Table 3 shows examples of attraction sales and the associated EBITDA multiple. The average EBITDA multiple across the deals is just over eight, meaning that, in general, attractions are worth around eight times their annual profits. This is a useful guideline for the scale of investment that can be supported by a new attraction.
However, this presents a challenge for developers and designers of new attractions, as it is often difficult to create the scale and vision that a developer is seeking for budgets that can be supported by the business and deliver a return.
Forecasting success
It is not uncommon for promoters of new projects to develop a bottom-up business plan based on a target investment level, with operating revenue and cost forecasts created to justify the scale of investment. Typically, these plans are over-optimistic, have little relationship to the size of the markets or demand levels, and do not reflect industry performance benchmarks. This may not stop them getting funded and built, but it often leads to financial problems when the operation cannot deliver on the forecasts.
Successful attractions developers and operators, such as Merlin Entertainments, understand the importance of balancing costs and values. Much of Merlin’s expansion has been through their midway attractions – Sea Life Centres, Dungeons, Madame Tussauds and Legoland Discovery Centres. These attractions are designed to a standard scale and budget, and new locations need to be able to deliver appropriate attendance levels and revenues to provide the company with a solid return on their investment. If a location cannot do this, they do not pursue the opportunity.
Success for Merlin is based on learning from past experiences and replicating proven business models. While this is not the only route to creating successful attractions, new developers would do well to take a leaf out of their book.