Management of operating costs is critical for all successful businesses. With visitor attractions reliant on guests coming through the entrance, and the patterns of these visits being influenced by weather, competitor activity and a range of external events, understanding the drivers of cost and how to manage these is essential.
There are two components of costs, fixed and variable. Fixed costs reflect the costs that are incurred whether the attraction is open or not. These include salaries for permanent staff, rent and rates, insurance, repairs and maintenance, animal welfare (for zoos and aquariums), administration and many of the utilities costs. Considering these costs spread evenly across the year gives a base level of business costs.
Variable costs are those that change with visitor or business volumes. Expenses such as the cost of goods for restaurants, shops and games, pay for temporary or seasonal staff, credit card fees, and some utilities are variable. Most of these expenses are only incurred if the attraction is open.
Seasonal considerations
A substantial proportion of costs at most attractions are fixed, and at attractions that are open year-round almost all costs could be considered fixed. However, an analysis of revenues against costs often reveals that attractions lose money during autumn and winter months. This raises the question of whether attractions should be open all year, or would benefit from closing to reduce the variable costs.
This is particularly relevant at theme and amusement parks where the large staff requirement to operate the rides and attractions represents a significant proportion of expenditure. Knowledge of historic visitor demand patterns aligned with a sound understanding of cost management allows for planning of an operating season to maximise days when revenue exceeds the variable costs and provide the strongest profitability.
While costs vary between attractions, examination of a range of different attractions reveals broad similarities in the benchmark ratios of operating costs.
Cost of goods sold
Cost of goods sold at restaurants and shops as well as for redemption games tends to follow typical percentage ranges:
• F&B – 20-40 per cent
• Merchandise – 30-50 per cent
• Games and other – 20-40 per cent
These costs exclude staff and only represent the cost of the goods. This is an important factor. If staff are added into the cost of these operations it often means profits generated from these activities can equate to 20-30 per cent of turnover. With such a small proportion of this income passing to the attraction, it’s not surprising that a number of attractions outsource the catering and retail activities to third parties.
Credit card, debit card and contactless payments have increased the scale of charges payable on these transactions. Fees can be up to 3 per cent of revenues. Cost of goods generally represents 10-15 per cent of operating costs.
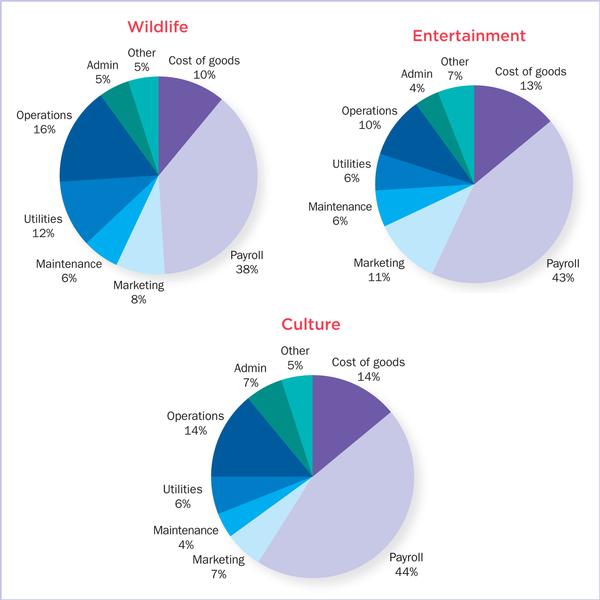
There is no standard way of reporting operating expenses so it is often difficult to benchmark attraction performance. We look to group costs into a limited number of broad headings to allow for such comparisons. The three pie charts show the average mix of operating expenses at different types of attractions.
Staff
As can be seen, the largest proportion of operating costs is almost always staff and this generally accounts for between 35 per cent and 50 per cent of operating costs with entertainment and cultural attractions spending a greater proportion of overall costs on staff than wildlife attractions.
This does not reflect low staffing levels at wildlife attractions, rather it is a reflection of the higher levels of utilities, animal husbandry and general operating costs that are incurred in the year-round operation of wildlife attractions.
Managing payroll costs presents a delicate balance. As it is the largest area of cost it offers the greatest potential for control. However, at attractions the front of house staff are the public face of the business. To recruit and maintain good staff requires competitive rates of pay and conditions and so any cuts in this area need to be carefully managed.
Marketing
The greater requirement for and spending on marketing at entertainment attractions and theme parks can clearly be seen in the pie charts, spending far more than wildlife or cultural attractions on marketing activities. Theme parks in particular undertake regular investment in new rides and it’s critical that their target markets are made aware of these additions.
The range of marketing channels increases every year. For many attractions, the traditional route of adverts, posters and brochures has been superseded by online activity and social media. For a number of attractions this has served to spread an already thin budget across too many channels and has resulted in some attractions focusing their marketing activity on social media almost entirely.
For attractions looking to cut costs, reducing marketing expenditure appears an easy target but this is often a short-sighted saving that leads to declining attendance through lack of awareness. By way of example, in the 1990s a theme park operator in Europe decided to cut the marketing budget by a quarter one year. This resulted in a 15 per cent drop in attendance that year and when the marketing budget was reinstated the following year admission numbers increased back to historic levels.
Rent
One aspect that can create significant variances at attractions is rent. This is generally included within the operations cost heading. A benchmark study across theme and amusement parks around the world in 2015 indicated that the on average, park operators spend around 10 per cent of their operating costs on rent and/or mortgage payments.
Clearly, paying low rent is advantageous to attractions but in city centres and retail environments it is often difficult to find suitable space at an affordable rent. A major factor in the failure of some city centre attractions has been unsupportable property costs and a business plan based upon meeting these costs rather than on a sounds assessment of likely demand.
Overall
There are other aspects that can be included in financial statements. Many organisations include depreciation, taxes and/or financial charges in their reported accounts. While these are expenditure items for accounting purposes they do cloud the picture and make comparisons and benchmarking difficult.
A clearer measure is made by excluding these items and assessing the operating profits on the basis of EBITDA. This stands for Earnings Before Interest, Tax, Depreciation and Amortisation and is a standard measure of a business’s true operating position. In the next article, we will discuss profits and the valuation of attractions based on EBITDA.