Visitor attractions are an important factor in many people’s travel plans. Some choose a destination in order to visit a specific attraction while others decide what to see once they arrive, but it’s rare for people not to visit an attraction while they’re on holiday.
This means that attractions around the world are well placed to benefit from the rapid growth of the tourism sector.
The World Travel & Tourism Council estimates that direct expenditure on global travel and tourism was worth a huge $2.5 trillion (£1.7tn, €2.2tn) in 2015 and the total economic impact of this sector was $7.9 trillion (£5.5tn, €7th).
Over the coming months, this series will provide an overview of the attractions sector and how it works from a business perspective. The series will review market size, diversity, dynamics and performance, as well as the all-important financial performance of a range of attractions.
The shape of the market
D&J estimates that there are about 250,000 visitor attractions globally, attracting in the region of 10 billion visits a year. However, it’s a very fragmented business. The world’s biggest attraction operator is Disney, whose 13 theme parks and waterparks attract 134 million guests annually, generating over $14bn (£9.7bn, €12.4bn) revenue for the company.
Although these are huge numbers, Disney actually draws less than 1.5 per cent of the world’s attractions visitors.
Furthermore, combined attendance at the top 10 global operating groups only accounts for 4 per cent of visits.
Most attractions are operated by national, regional or local governments, by small regional groups or by individuals or families. This fragmentation means there’s relatively little data available on the industry when compared with the hotel or transportation sectors where there are greater proportions of large operators.
Differences in scale
The museum sector varies widely in size from country to country. For example, there are around 1,500 museums in Spain, 1,800 in the UK, 3,600 in China, 6,400 in Germany and a massive 16,000 in the US. Between them, they attract almost 1.3 billion visits each year – that’s an average of almost 45,000 visits per museum.
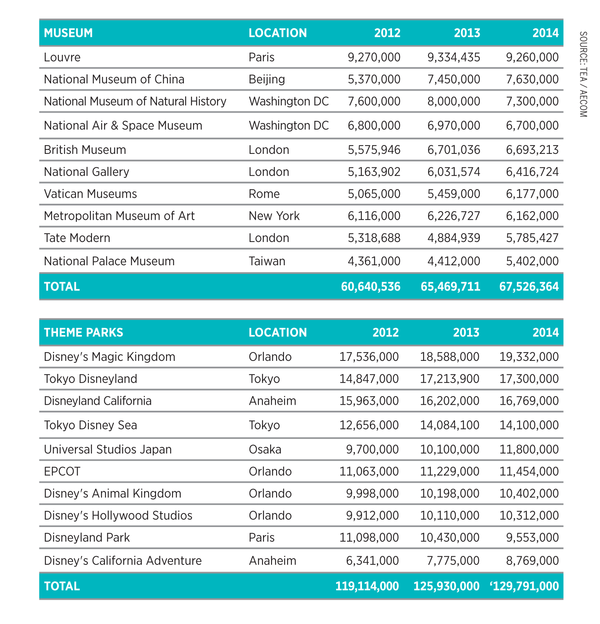
Data from the TEA/AECOM Theme Index and Museum Index (see Table 1 on page 56) reveals that admission to the world’s top museums and theme parks has grown strongly in recent years.
At the top of the list, the Louvre in Paris is the world’s most visited museum, with 9.3 million visits annually. Among zoos, the honour goes to Chapultepec Zoo in Mexico, with 5 million visitors a year – and Disney’s Magic Kingdom in Orlando, with 19.3 million guests in 2014, is the most visited park.
Free attractions
Moving outdoors, there are many free-to-enter natural attractions, historic sites and national parks. Visitor numbers to these locations are estimated based on surveys and the volumes are impressive: 9 million to the Great Wall of China; 15 million to the Golden Gate Park in California; 15 million to the Forbidden City in Beijing; 22 million to Niagara Falls and 37 million to New York’s Central Park.
These attractions are internationally famous destinations run by large operating teams who have substantial resources at their fingertips. However, the majority of visitor attractions are modest in size and run by small groups, families, volunteers, charities or regional or local governments – without the luxury of deep pockets.
The 80:20 rule
While every attraction is unique, there are similarities and patterns in visitor behaviour, guest spending, operating cost ratios, market penetration rates and profitability across different attraction types. It’s these patterns and ratios this series will be examining.
There are also similarities and patterns across attractions in different countries and regions. The 80:20 rule applies in leisure; 80 per cent of what people do is comparable around the world, but it’s understanding the 20 per cent local context that makes or breaks an operation. For example, the basics of running a restaurant are always the same. You need good food and service, an enjoyable ambience and value for money. These are the 80 per cent factors. The 20 per cent is understanding local tastes, patterns and demands. In the Midwestern US, restaurants typically close by 10pm, while in Spain time people are just sitting down to eat at that time. Local context is critical.
The Attractions Business series will discuss the challenges that are facing visitor attractions, highlighting the world’s strongest performers and helping to build a deeper understanding of the dynamics of this vital industry.